

How to Build Automated Monitoring Alerts for Microsoft Fabric
Introduction
If you’ve been working with Microsoft Fabric in production environments, you’ve probably faced this critical question: “How can we monitor our pipelines, notebooks, and processes with automated notifications when something goes wrong?”
Here’s the thing—as of now, there’s no built-in functionality in Microsoft Fabric that fully addresses this need. The recently announced Workspace Monitoring doesn’t cover dataflows, pipelines, or notebooks. For many teams, this is actually a “hard stop” for moving to production, since they can’t react quickly and efficiently when failures happen.
Since this question keeps coming up with every Fabric implementation, I decided to dig deeper and explore what’s currently possible. While there’s no official documentation, I found a way to tap into the same data that powers Fabric’s Monitoring Hub. Let me show you how.
Discovering the Monitoring API
The first step was understanding how the Monitoring Hub actually works under the hood. To do this, I used the browser’s developer tools to peek at what’s happening behind the scenes.
Here’s what I did: I opened Developer Tools (hit F12 in most browsers), switched to the Network tab, and started recording all API calls. Then I opened the Monitoring Hub tab in Fabric:
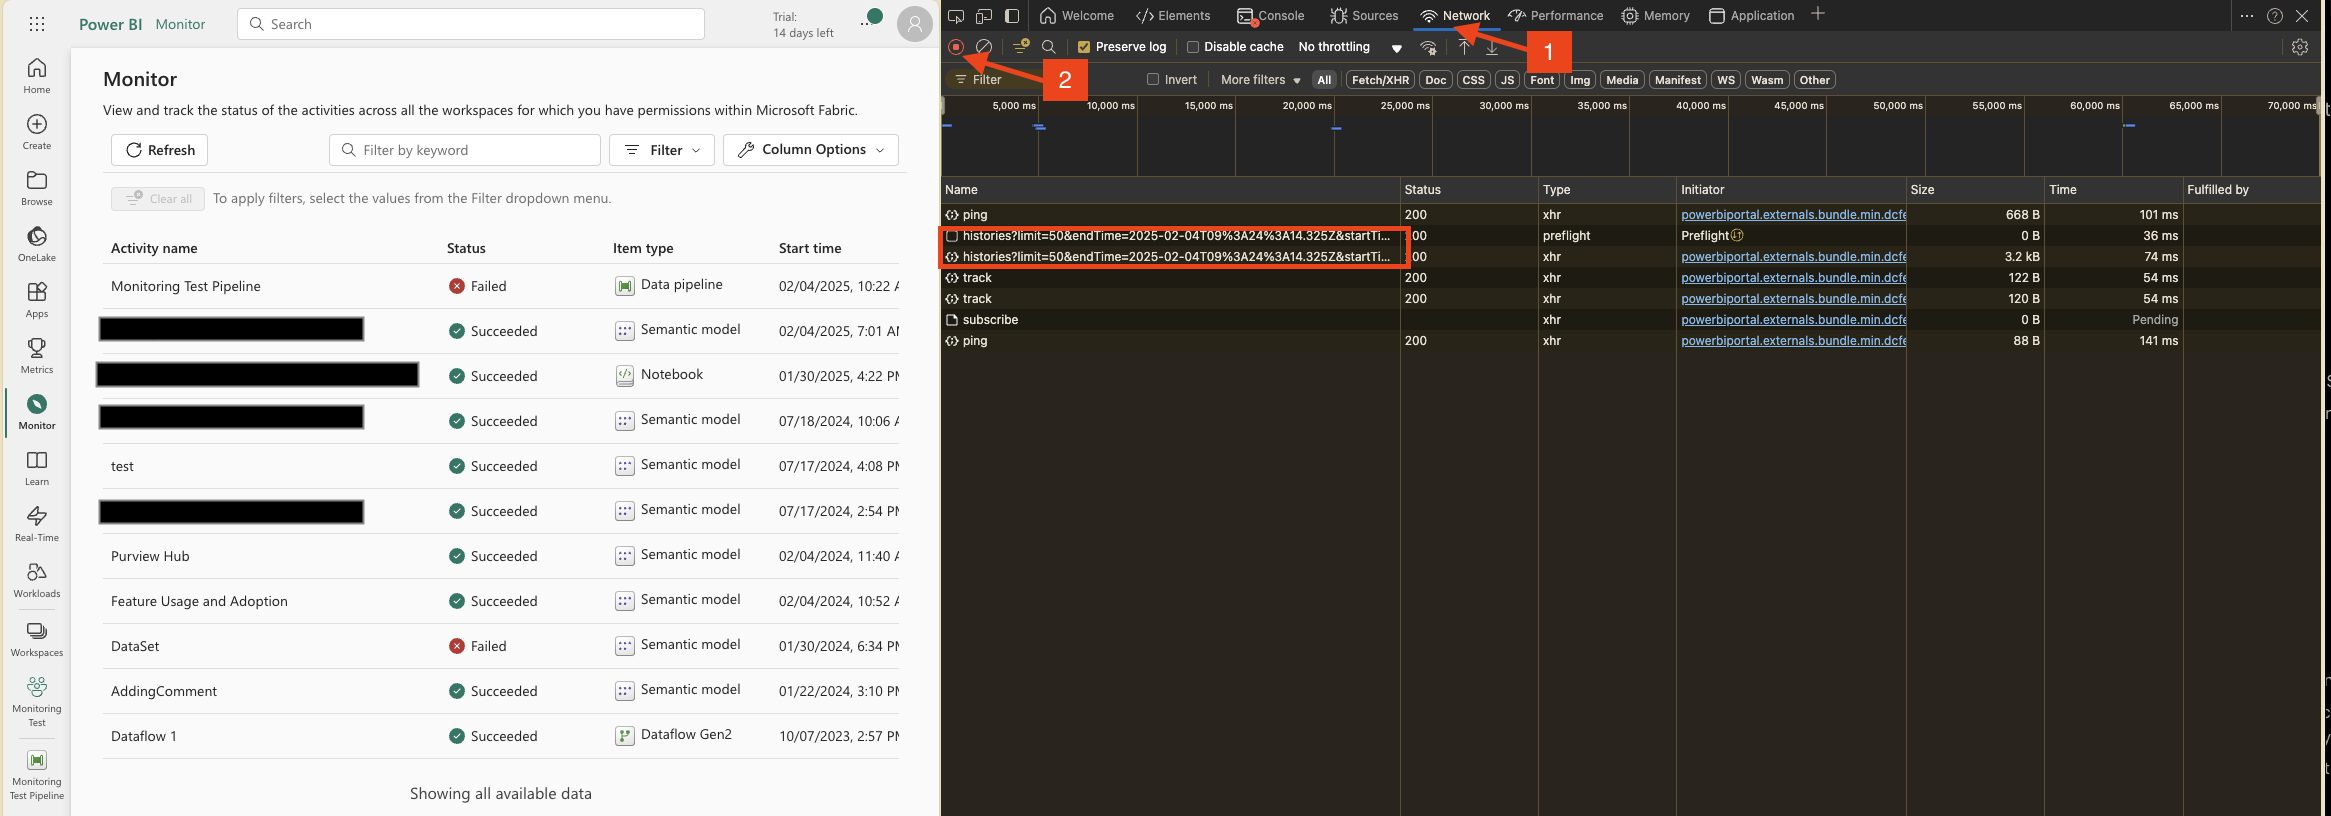
As you can see in the screenshot, several API calls are being made. The highlighted one is particularly interesting—this is the actual endpoint that Monitoring Hub uses to fetch execution data.
When you click into the details of that API call, you’ll see something like this:
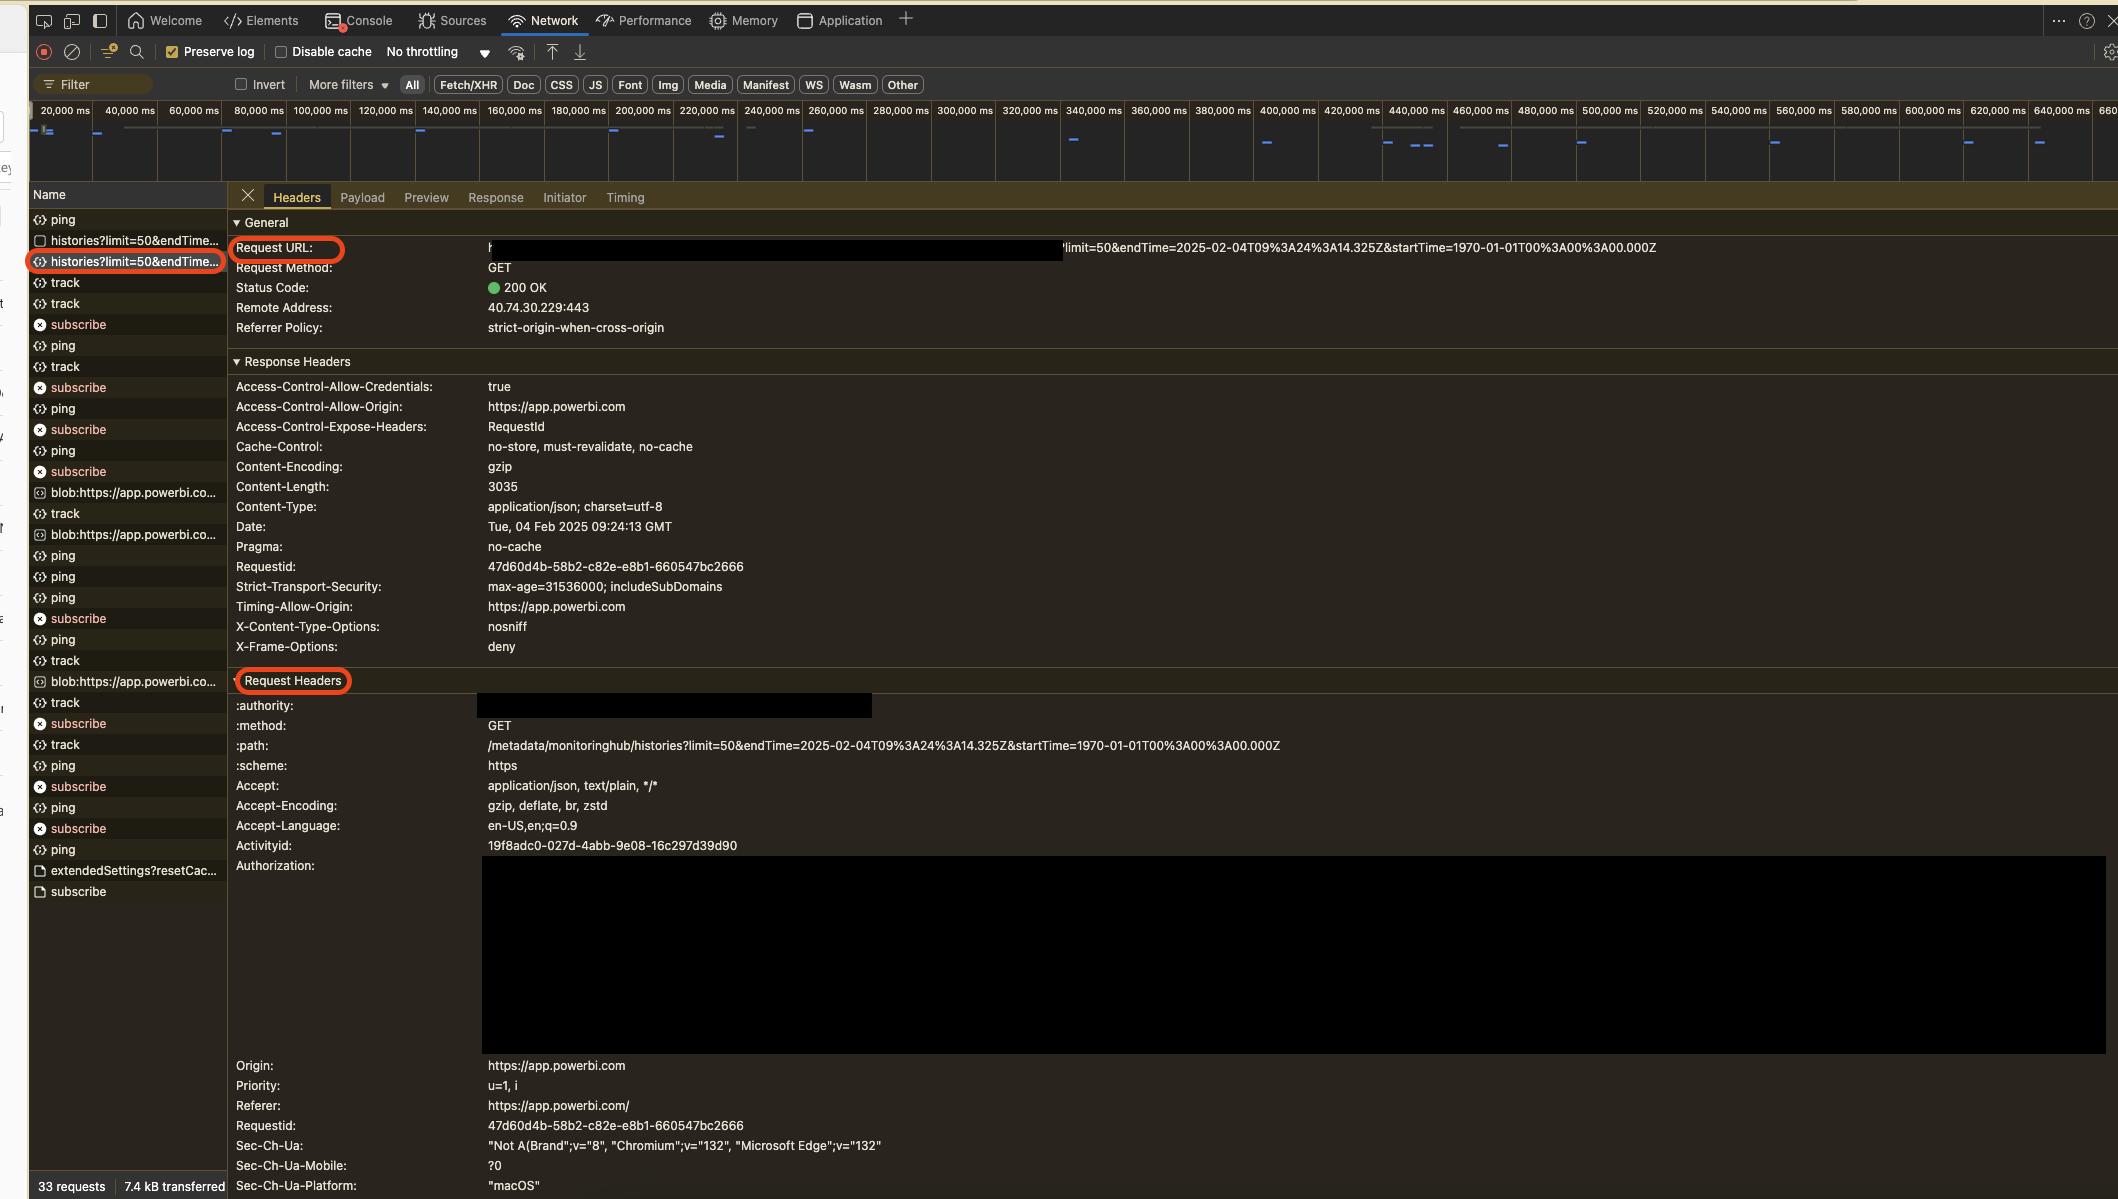
The highlighted sections show the key information you’ll need to construct your own REST API call to the same endpoint. This means you can access exactly the same data that Monitoring Hub displays—programmatically!
Understanding the API Payload
Now, let’s look at the “Payload” tab to see what parameters are being sent:
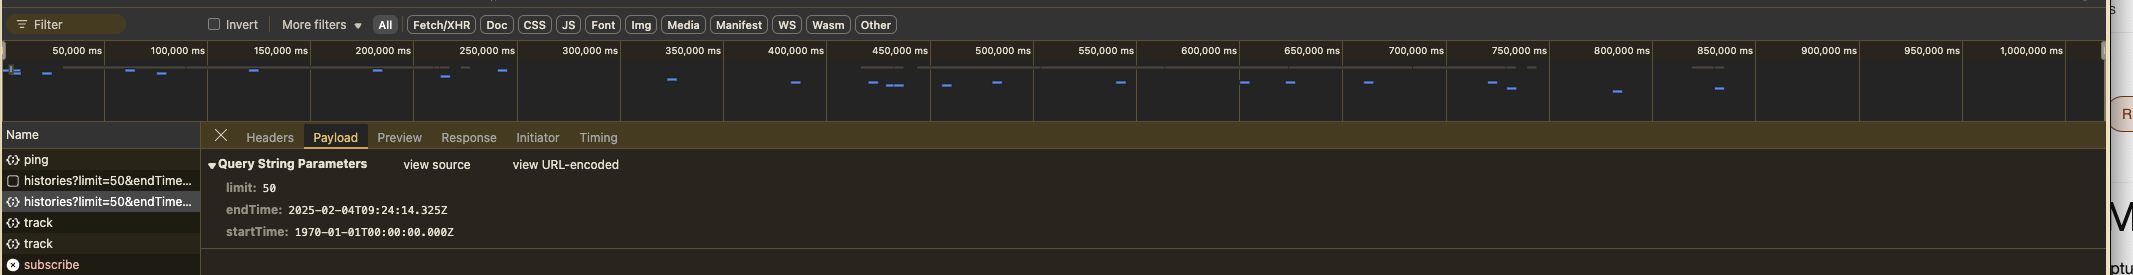
Here are the three main parameters you’ll work with:
- limit – Sets the maximum number of rows the API will return
- endTime – Defaults to the current time; filters executions by their Start Time
- startTime – Defaults to 1970-01-01; filters executions by their Start Time
Heads up: You can discover additional parameters by modifying filters in the Monitoring Hub and checking the subsequent requests. For example, when I filtered to show only failed processes:
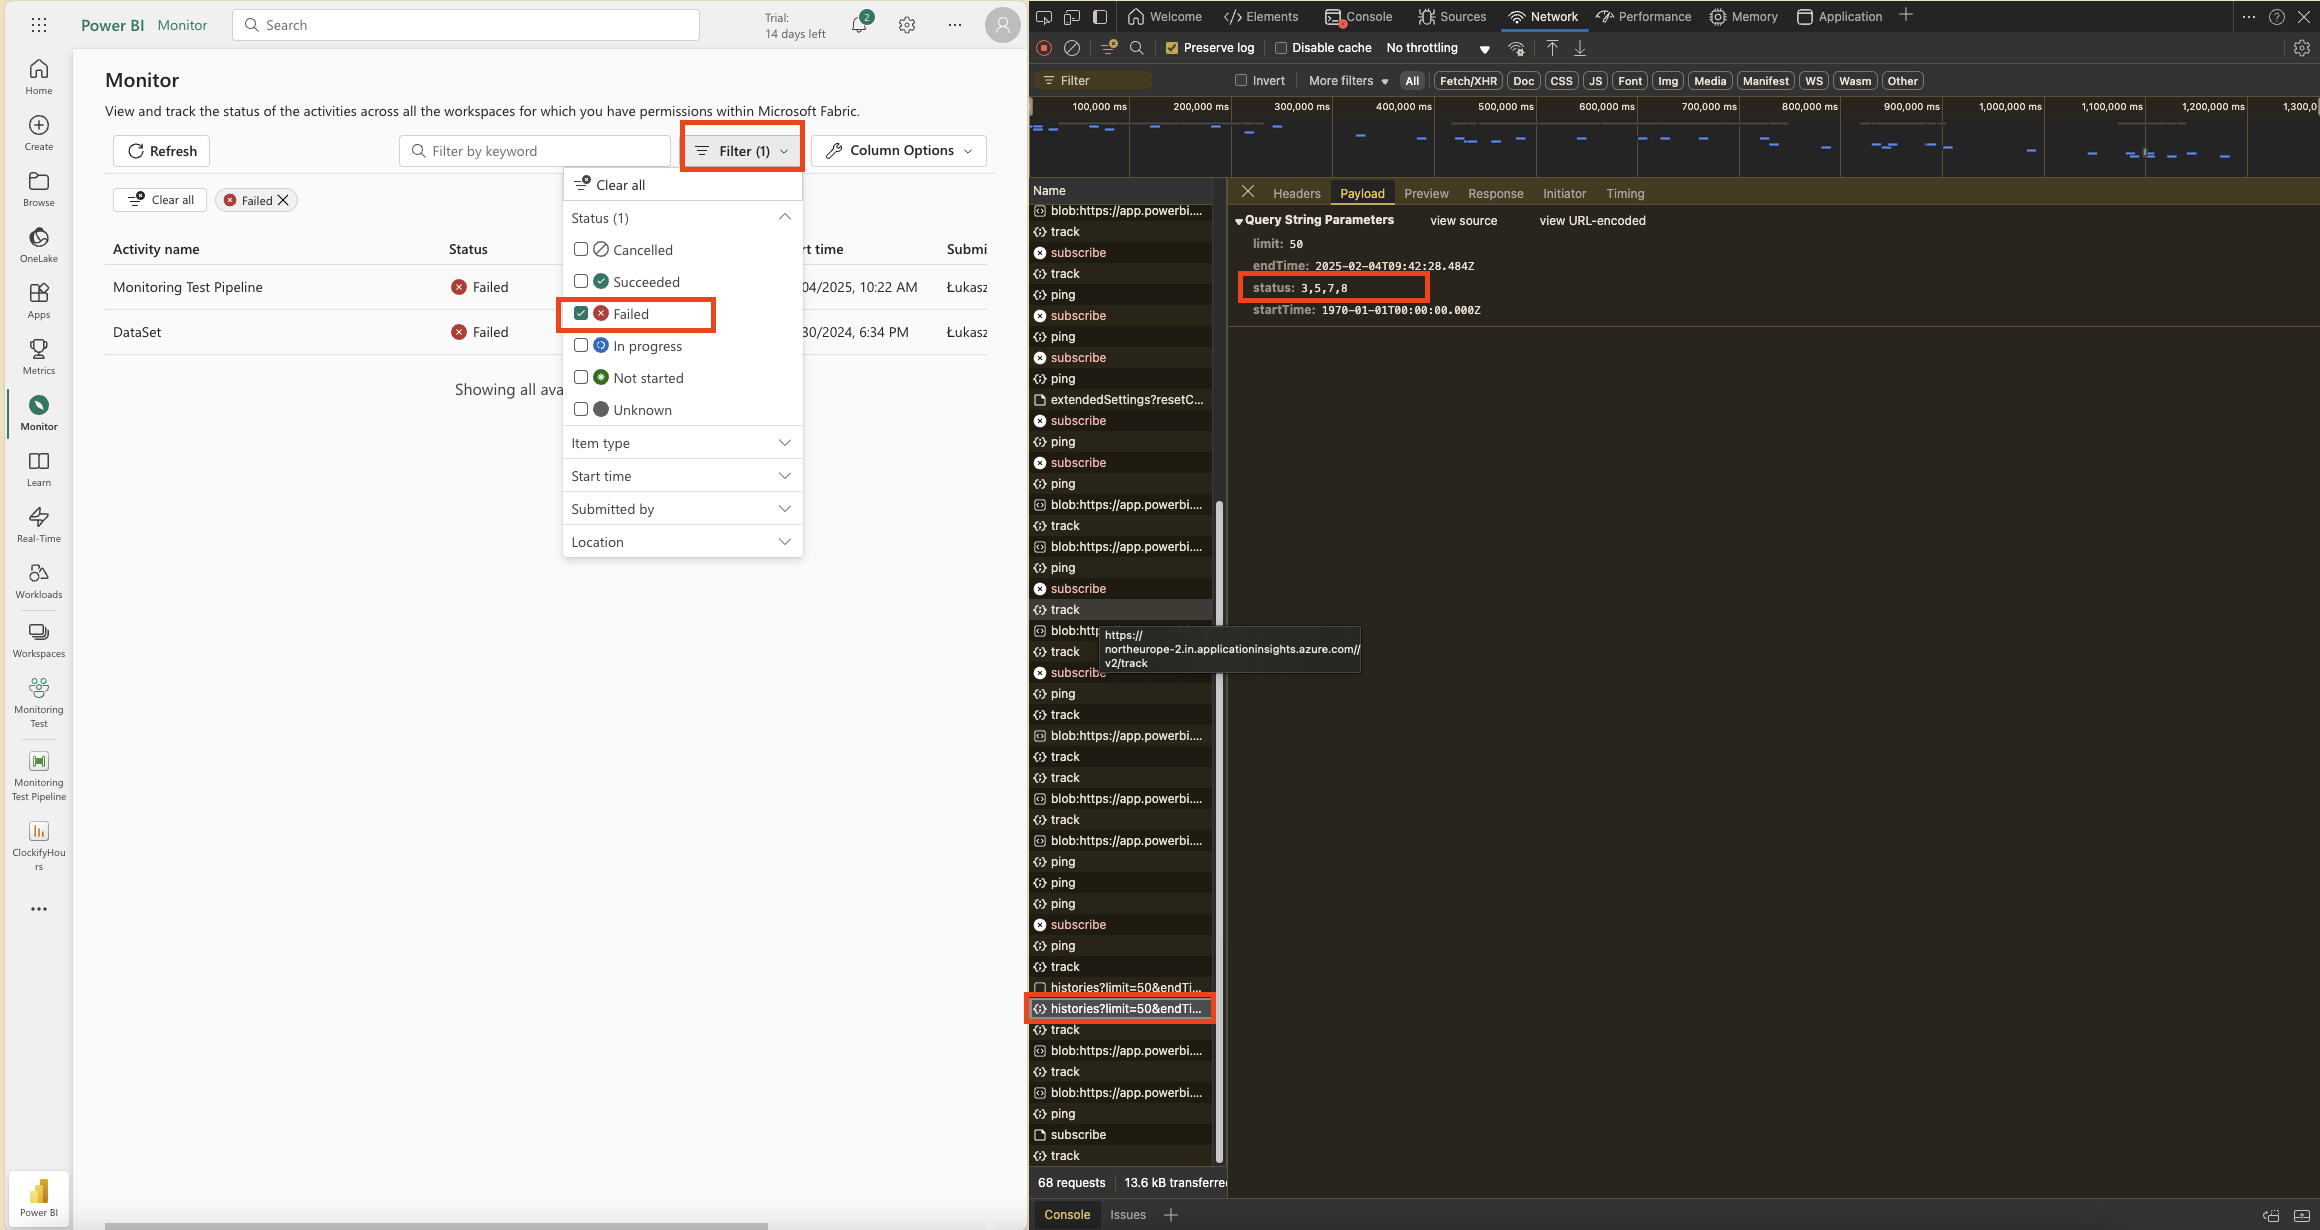
The payload revealed a new parameter called status with values: 3, 5, 7, 8. These represent different failure statuses. I don’t know the exact difference between them since there’s no official Microsoft documentation for this API—but the key point is that we can modify the API call to filter the output we need.
You can experiment with different filters in the Monitoring Hub and check the Network tab to see what parameters get added. This way, you can craft the perfect API call for your specific monitoring needs.
What Data Can You Access?
The API response gives you everything displayed in the Monitoring Hub:
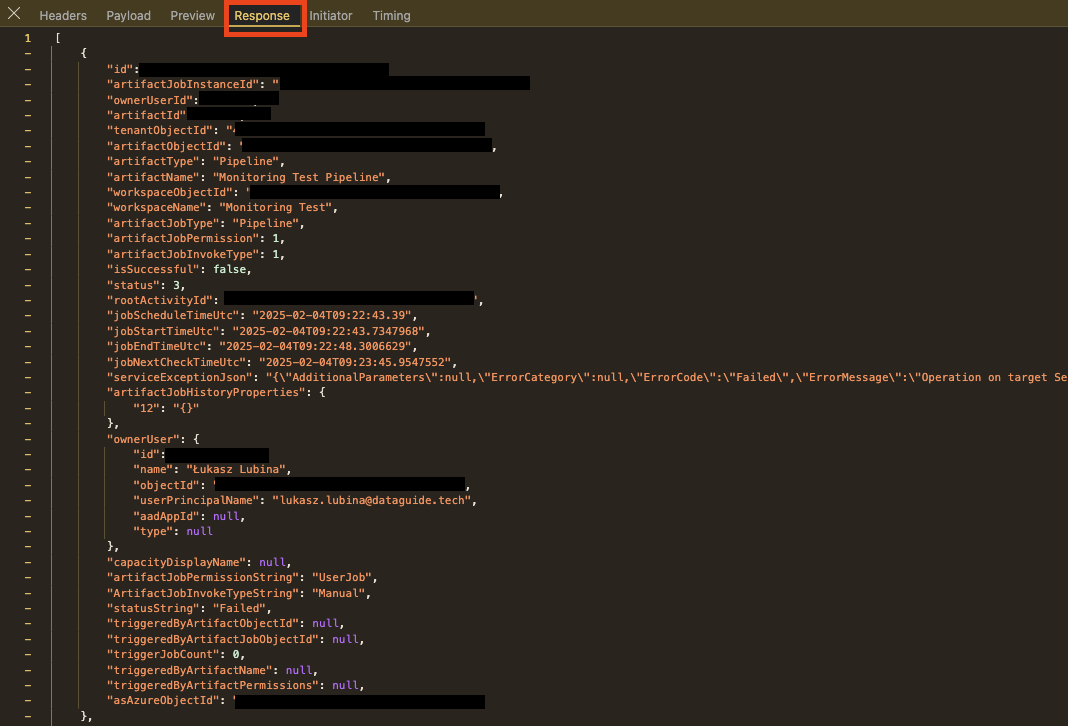
This includes:
- Object IDs and workspace IDs
- Start and end times
- Job owner information
- Execution status
- The
serviceExceptionJsonfield—which contains detailed error information
This last field is particularly valuable for understanding what went wrong in a failed execution.
Automating Monitoring with Python
Ok, now that I knew what the Monitoring Hub uses behind the scenes, I wanted to automate the whole process using Fabric Notebooks. My goal was simple: load the execution logs into a Lakehouse table, then use that data to send email or Teams notifications when issues occur.
Below you can find the script I created.
Import Libraries
Start by importing the necessary libraries: requests for making HTTP requests, pandas for data manipulation, and json for handling JSON data.
# Import all libraries
import requests
import pandas as pd
import jsonGet Authorization Token
Obtain an authorization token using the mssparkutils.credentials.getToken method. This token is essential for accessing the API.
# Get Authorization Token
token = mssparkutils.credentials.getToken("https://api.fabric.microsoft.com")Prepare API Request
Define the URL and parameters for the API request. The parameters include filters for the data we want to retrieve, such as the time range and status codes.
Please note: You can adjust these parameters based on your needs by checking the payload from the Network details as we discussed earlier.
# Prepare API request details
url = "{PUT YOUR URL}"
params = {
    "limit": 10000, # Maximum number of rows to be retrieved
    "endTime": f"2025-02-04T09:42:28.484Z", # Limiting range of StartTime of the Job
    "startTime": f"1970-01-01T00:00:00.000Z", # Limiting range of StartTime of the Job
    "status":"3,5,7,8", # Filterout only error rows
    "Accept": "application/json", # Do not manipulate to get json output
    "accept-encoding": "gzip, deflate, br, zstd", # Do not manipulate
    "activityid": "d6678b61-1c72-4e43-9498-54b715064543", # It could be any GUID
    "accept-language": "en-US,en;q=0.9" # Do not manipulate
}
headers = {
    "Authorization": f"Bearer {token}" # Authorization using the generated token
}
Execute API Call
Make the API call using the requests.get method and store the response.
# Execute API call and save a response to variable
response = requests.get(url, headers=headers, params=params)Process JSON Data
Extract the JSON data from the response and convert it into a pandas DataFrame for easy manipulation and analysis.
# Take json data from response and save it to variable
data = response.json()
# Open JSON and save it as pandas DF
df = pd.json_normalize(data)What’s Next?
That’s it for Part 1! You now have a DataFrame with all your execution logs, which you can load into a Lakehouse table, analyze, or use as the foundation for alerting.
In Part 2, I’ll show you how to build on this foundation to create automated notifications via email and Teams, plus how to set up reporting dashboards for your monitoring data.
Want to see Part 2? Let me know in the comments if you’re interested in the notification and reporting setup—I’d love to hear what specific monitoring scenarios you’re dealing with!
Happy monitoring!