How to Build Microsoft Fabric Monitoring with Automated Alerts – Part 2
Microsoft Fabric monitoring is essential when you’re running production pipelines – you need to know when something breaks before your users do. In my previous post, I walked through how to connect and ingest logs using a notebook. Now let’s take it a step further – automating the entire process with built-in alerting.
By automation, I mean creating a pipeline with a notification system that fires off alerts the moment something goes wrong. This setup enables early detection of anomalies and issues, giving you time to resolve them before they snowball into bigger problems.
To achieve this, I extended my previous notebook and integrated it with Fabric Data Factory pipeline orchestration. The goal was to log every entry from the tenant to monitor pipeline failures, and support team alerts.
Here’s what we’ll cover:
- Ingesting logs from the Fabric API endpoint
- Loading them into Lakehouse
- Setting up alerts when issues are detected
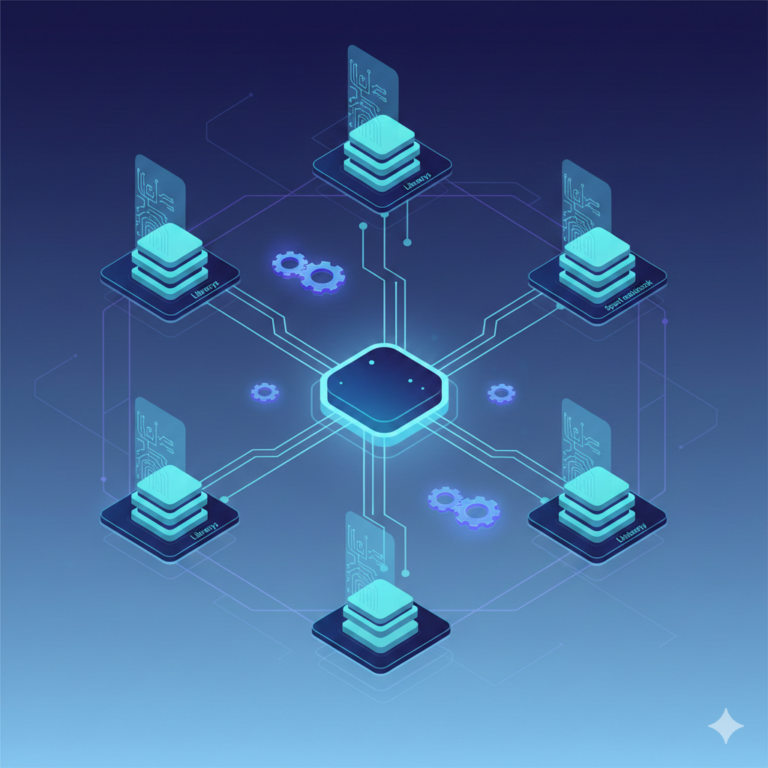
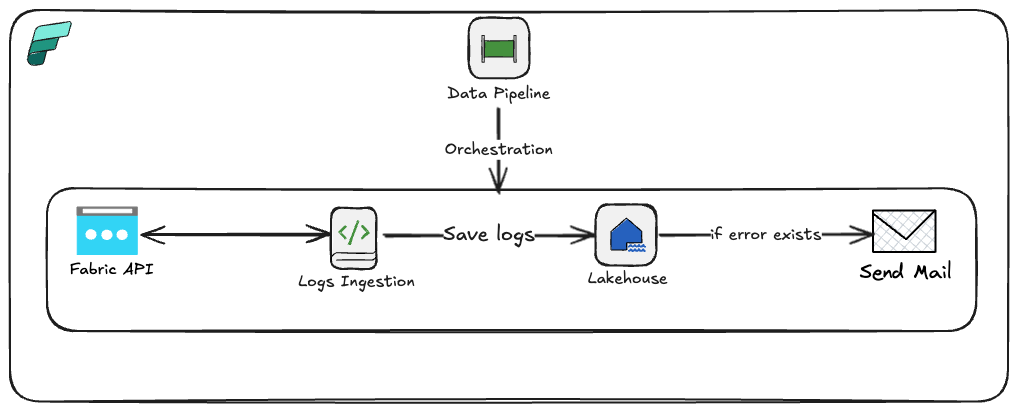
I scheduled the flow to run every 30 minutes, but you can run it more frequently depending on your capacity. I’m using the trial version which corresponds to F64, and the entire flow takes around 3-5 minutes. Below you can find an overall picture of the architecture.
Ok, let’s now go to the Fabric workspace to present the technical details.
Setting Up Microsoft Fabric Monitoring Notebook
Starting from the beginning – I’ve extended the notebook to ingest and load data into Lakehouse as follows:
Add Pipeline Run ID Parameter
Start by adding a new cell at the top to capture the pipeline_run_id from the Fabric Pipeline. By default, you can set it to any GUID for testing purposes.
pipeline_rund_id = "1caf67a5-2bba-4085-920c-6b3f07c90523" #You can add any GUIDHeads up: You need to set that cell as a toggle parameter: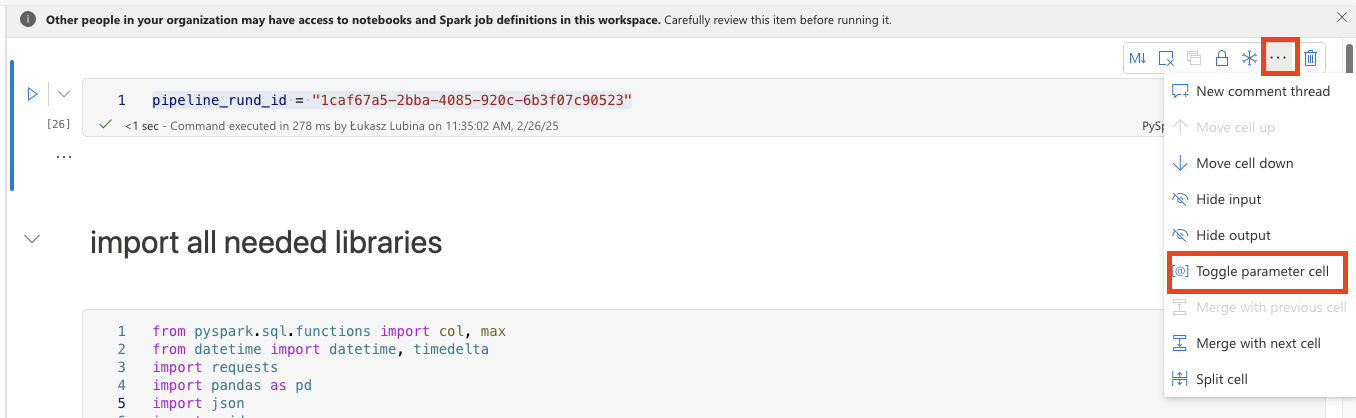
Import Libraries
Import the necessary libraries: requests for making HTTP requests, PySpark (col, max) for column selection and aggregation, pandas for data manipulation, json for handling JSON data, datetime for date and time manipulation, and UUID for unique identifier generation.
# Import all libraries

from pyspark.sql.functions import col, max
from datetime import datetime, timedelta
import requests
import pandas as pd
import json
import uuidExecute API Call
Make the API call using the requests.get method and store the response.
# Execute API call and save a response to variable
token = mssparkutils.credentials.getToken("https://api.fabric.microsoft.com")
Define Time Range for Log Ingestion
Define the start and end date for log ingestion. The default setting is to take all logs starting from the last logged item till now. If there’s no table yet (initial run), do ingestion for the last 24 hours.
try:
	fabric_logs_main_df = spark.read.format("delta").load(f'Tables/fabric_logs')
	start_time = fabric_logs_main_df.agg(max("jobStartTimeUtc")).collect()[0][0]
except:
	print('No Table Found - setting yesterday as time to get the logs.')
	start_time = datetime.today() - timedelta(hours=24, minutes=0)

end_time = datetime.today()Prepare API Request
Define the URL and parameters for the API request. The parameters include filters for the data you want to retrieve – in this case, taking all data from the latest saved logs (based on start_time variable) till current time (based on end_time variable). It also limits the statuses to only finished ones, excluding in-progress, pending, and queued processes.
url = "<YOUR URL>"
params = {
    "limit": 10000, # Maximum number of rows to be retrieved
    "endTime": f"{end_time}", # Limiting range of StartTime of the Job
    "startTime": f"{start_time}", # Limiting range of StartTime of the Job
    "status":"4,6,2,3,5,7,8", # All processed statuses. Excluded all in_progress or pending.
    "Accept": "application/json", # Do not manipulate to get json output
    "accept-encoding": "gzip, deflate, br, zstd", # Do not manipulate
    "activityid": "d6678b61-1c72-4e43-9498-54b715064543", # It could be any GUID
    "accept-language": "en-US,en;q=0.9" # Do not manipulate
}
headers = {
    "Authorization": f"Bearer {token}" # Authorization using the generated token
}Execute the API Call
Make the API call and store the response.
# Execute API call and save a response to variable
response = requests.get(url, headers=headers, params=params)Process JSON Data
Extract the JSON data from the response and convert it into a pandas DataFrame for easy manipulation and analysis.
# Take json data from response and save it to variable
data = response.json()
# Open JSON and save it as pandas DF
df = pd.json_normalize(data)Add Pipeline Run ID Column
Add pipeline_run_id to recognize which pipeline run collected which logs.
df['pipeline_run_id'] = pipeline_rund_idCheck for Captured Logs
Check if the DataFrame is empty and set up the df_processing flag to determine whether to save to the Lakehouse table.
if not df.empty:
    df_processing = True
else:
df_processing = FalseLoad DataFrame to Table
Check if the df_processing flag is True, then convert all columns to string. This isn’t the most elegant solution, but since we’re lacking proper documentation from Microsoft to rely on, I’d suggest starting with this approach and then adjusting columns to proper datatypes later. The logs are loaded in append mode with mergeSchema option set to true so you don’t lose any new columns that might appear.
if df_processing:
    for col_name in df.columns:
        df[col_name] = df[col_name].astype('str')
    df = spark.createDataFrame(df)
df.write.format("delta").mode("append").option('mergeSchema', 'true').save('Tables/fabric_logs')Create Failures DataFrame
Filter only failed execution logs and store them in a new DataFrame called df_failures.
df_failures = df.filter(df.isSuccessful == False)Check for Failures
Check if df_failures is empty and set up the df_failures_processing flag to determine whether to create a list of errors for Teams/email notifications.
if not df_failures.rdd.isEmpty():
    df_failures_processing = True
else:
df_failures_processing = FalsePrepare Array for Notifications
Select and rename informative columns from df_failures (these work for me but you can adjust based on your needs), convert the DataFrame to a JSON list, and assign it to result_array. If df_failures_processing is false, result_array is set to an empty list.
if df_failures_processing:
    from pyspark.sql import functions as F
    result_df = df_failures.select(
        df_failures["workspaceName"], # Name of the workspace
        df_failures["workspaceObjectId"].alias("WorkspaceId"), # Workspace ID
        df_failures["artifactName"].alias("FailedItemName"), # Name of the item failed
        df_failures["artifactType"].alias("FailedItemType"), # Type of the failed item (like pipeline, notebook etc.
        df_failures["serviceExceptionJson"].alias("ErrorDetails"), # Json with ErrorDetails
        df_failures["`ownerUser.name`"].alias("OwnerUserName"), # Owner user name of failed item
        df_failures["`ownerUser.userPrincipalName`"].alias("OwnerUserEmail"), # Owner email of failed item
        df_failures["jobScheduleTimeUtc"], # Scheduled time
        df_failures["jobStartTimeUtc"], # Start time
        df_failures["jobEndTimeUtc"] # End time
    )
    # collect failures and format to json
    result_json = result_df.toJSON().collect()
    # format json to a list, to send them separetely.
    result_array = [json.loads(item) for item in result_json]
else:
result_array=[]Close Notebook with Output
Pass the array as output from the notebook, which will be used in the Fabric Pipeline to send email/Teams notifications.
mssparkutils.notebook.exit(json.dumps(result_array))Creating the Microsoft Fabric Monitoring Pipeline
The next thing to prepare is the Fabric Pipeline for orchestrating the whole process.
Create Pipeline and Add Notebook Activity
First, create a new pipeline. In the pipeline, add the Notebook activity and select your prepared notebook:
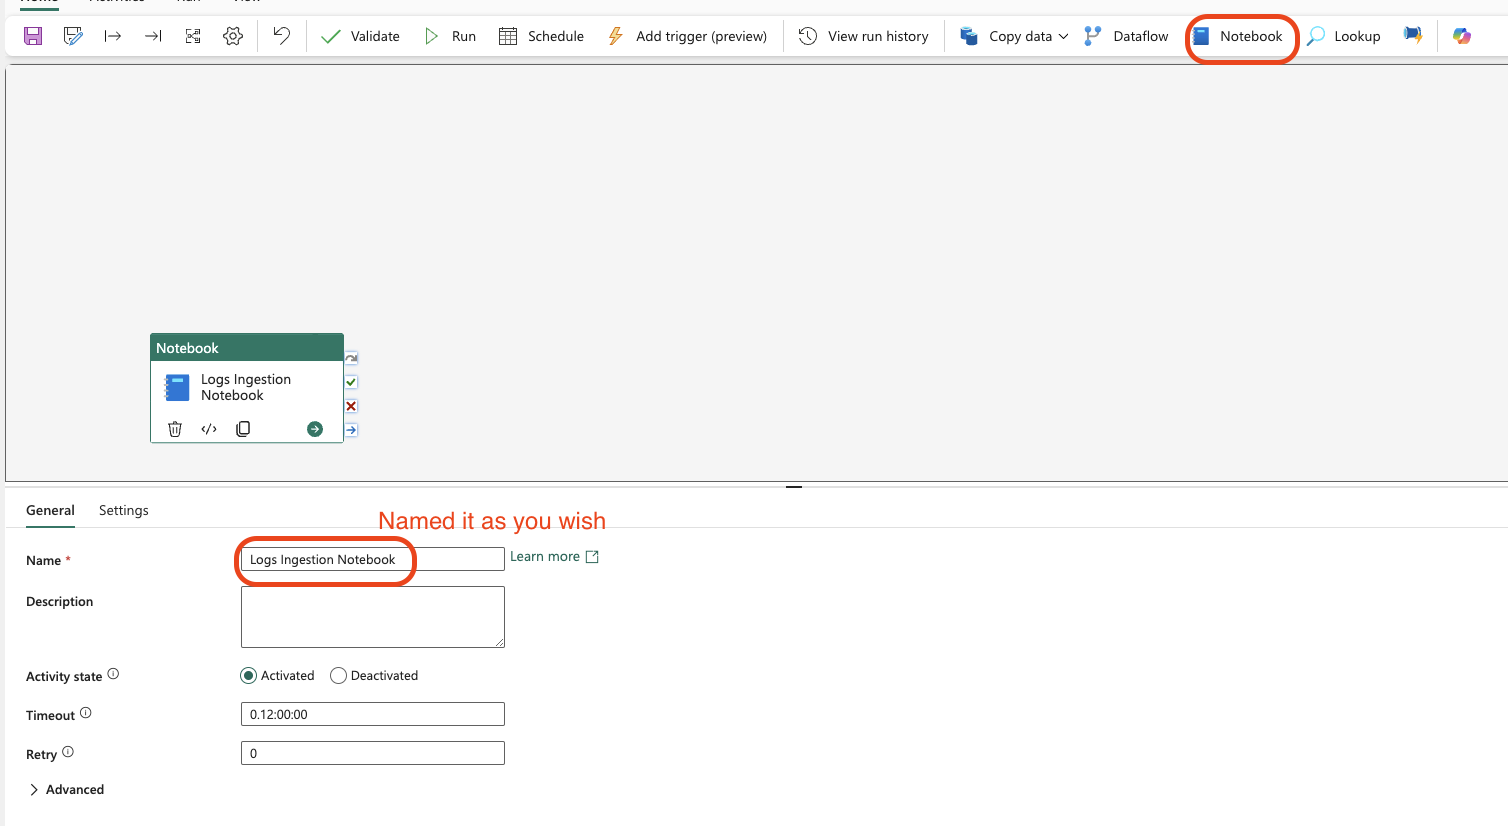
Configure the Notebook Activity
Configure the notebook to be executed:
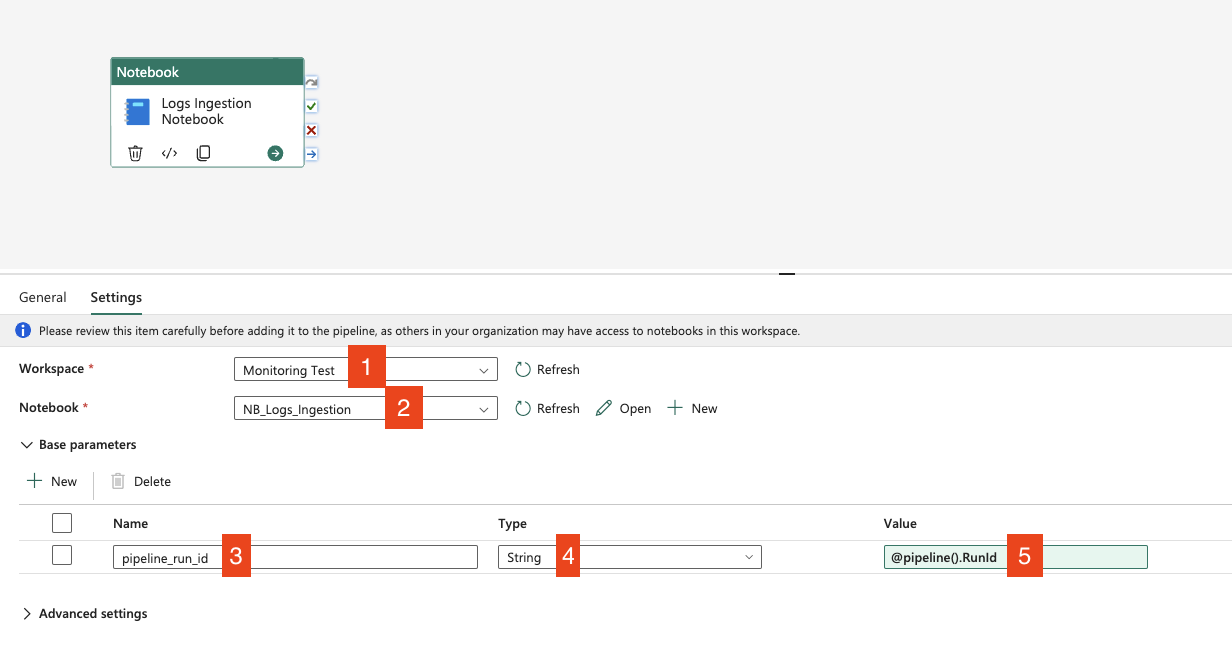
- Choose the workspace where you have the notebook created
- Choose the notebook for logs ingestion
- Add the name of the parameter from the toggle parameter cell – in my case it’s
pipeline_run_id - Choose
Stringdata type - Click on
Add dynamic contentand add the following value:@pipeline().RunId. This takes the system variable which is the unique identifier of the running pipeline – you can check the details here: Parameters – Microsoft Fabric | Microsoft Learn
Configuring Alert Notifications
Now it’s time to set up the notifications. First, add a ForEach loop activity, which will execute notifications for each item from the result_array.
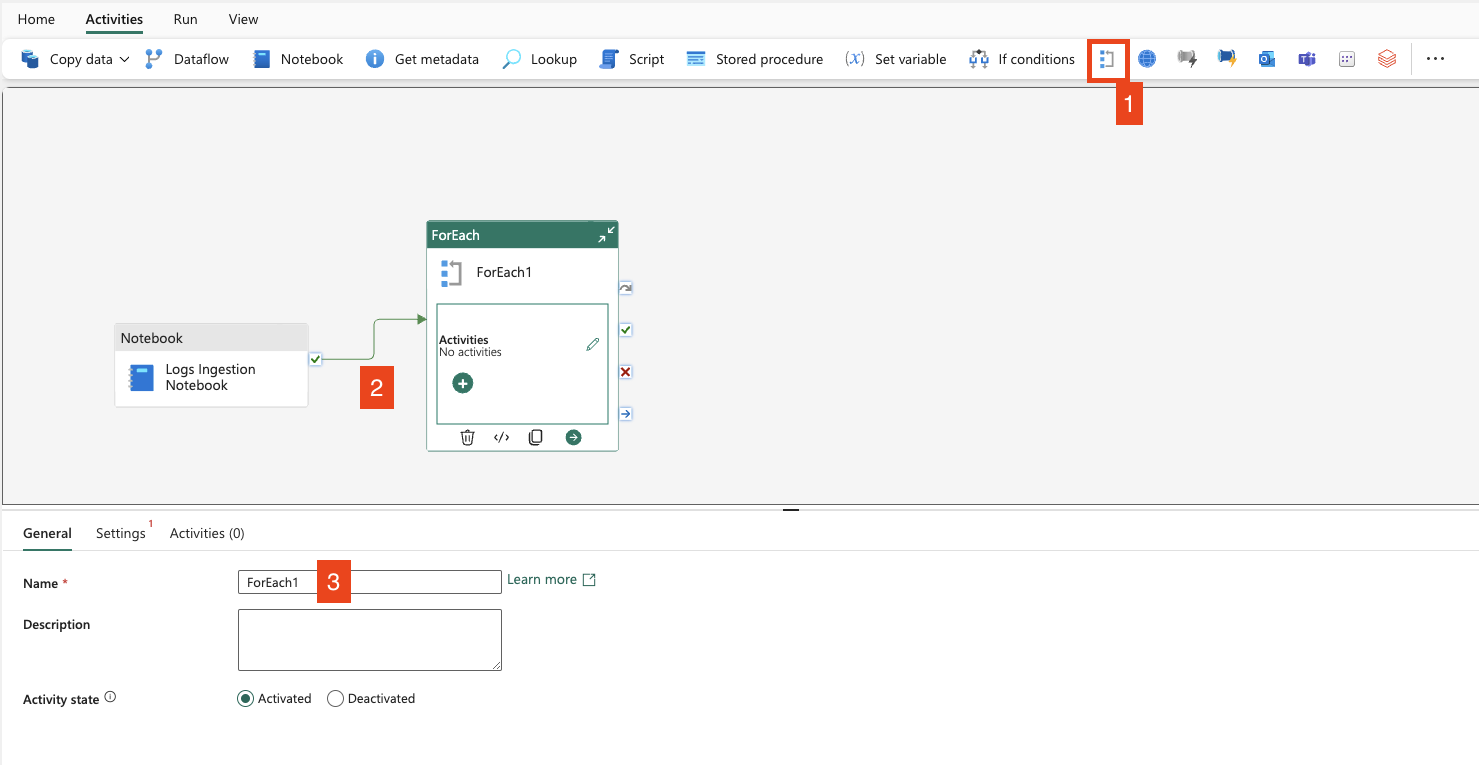
- Add ForEach loop activity
- Link it by
On Successpath - Name it as you wish

- Go to the
Settingstab - Leave sequential option unchecked – this allows ForEach to run in parallel
- Set up batch count – this limits the number of parallel runs (I’ve set it to 10)
- Add array output from Notebook using:
@json(activity('Logs Ingestion Notebook').output.result.exitValue)
Add Email Notification
Now click on “Edit” in the ForEach loop and add Teams or Outlook activities. I’ll set it up for emails.
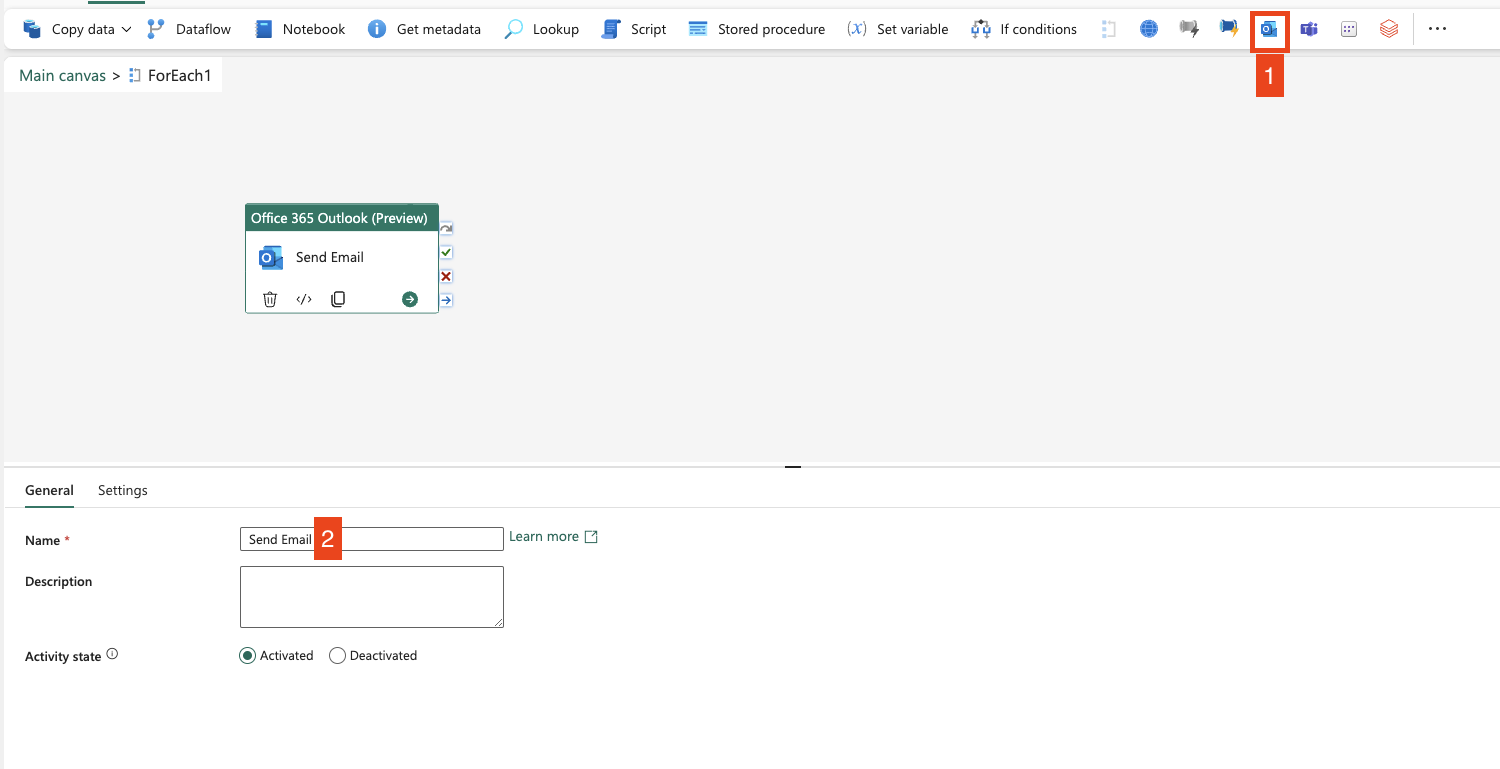
- Add Outlook activity
- Name it as you wish
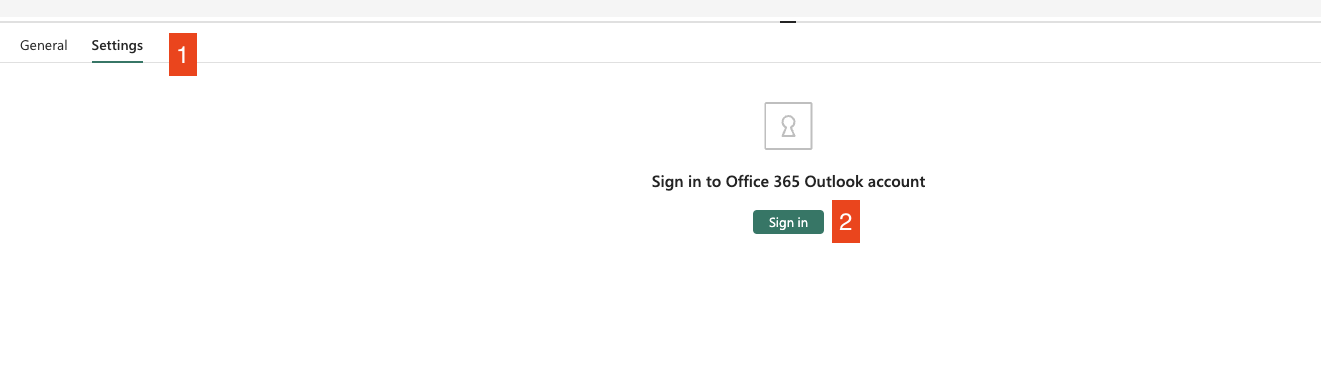
- Go to the Settings tab
- Sign in using your account or a prepared technical email for notifications. Once signed in, the activity will show you the menu to set up the email
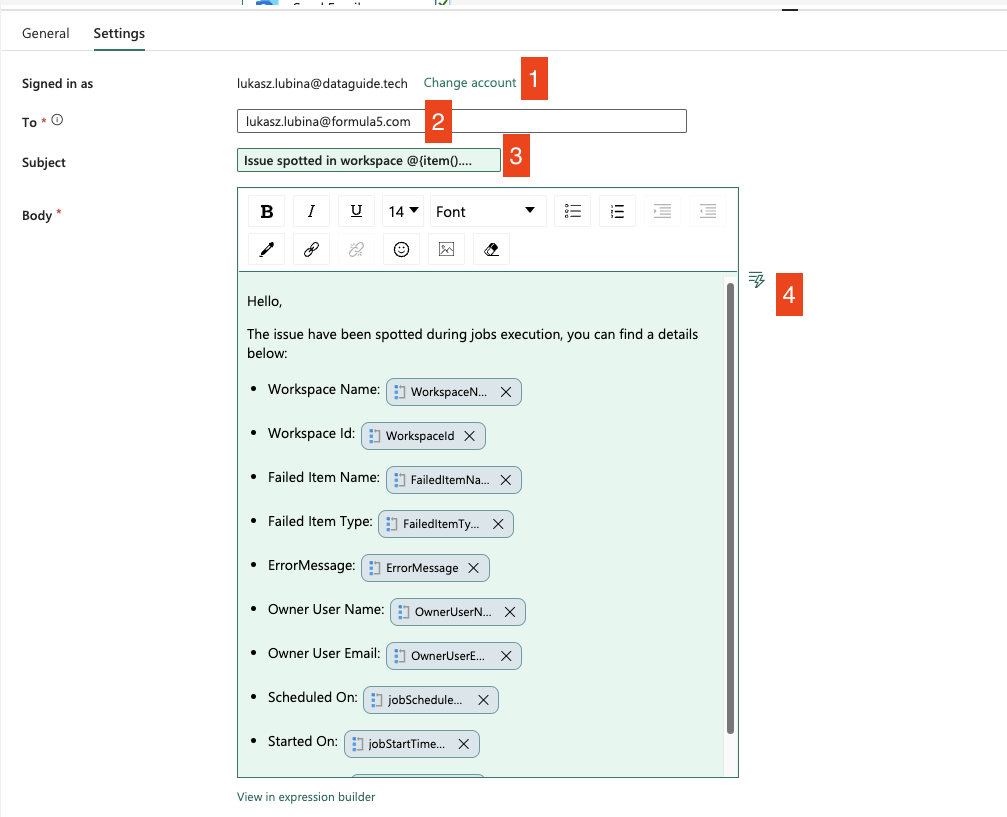
- Here the account you’re logged in with will be displayed – this will be used for email notifications
- Add the email address where you want to send the notification
- Subject of the email – I’ve added an expression to build the subject “Issue spotted in workspace <workspace_name>”. Expression:
Issue spotted in workspace @{item().WorkspaceName} - Body of the email – I’ve listed all items from the
result_arraylike this:
<p>Hello,</p>
<p>The issue have been spotted during jobs execution, you can find a details below:</p>
<ul>
  <li>Workspace Name: @{item().WorkspaceName}</li>
  <li>Workspace Id: @{item().WorkspaceId}</li>
  <li>Failed Item Name: @{item().FailedItemName}</li>
  <li>Failed Item Type: @{item().FailedItemType}</li>
  <li>ErrorMessage: @{item().ErrorMessage}</li>
  <li>Owner User Name: @{item().OwnerUserName}</li>
  <li>Owner User Email: @{item().OwnerUserEmail}</li>
  <li>Scheduled On: @{item().jobScheduleTimeUtc}</li>
  <li>Started On: @{item().jobStartTimeUtc}</li>
  <li>Finished On: @{item().jobEndTimeUtc}</li>
</ul>
GitHub Repository
The whole solution is available on my GitHub Repository: GitHub. You can sync the content directly to your Fabric workspace.
Wrapping Up
Automating log ingestion and monitoring using Fabric Data Factory pipeline orchestration can significantly enhance your ability to detect and resolve issues swiftly. By setting up a robust alerting system, you ensure that anomalies are promptly addressed, minimizing potential disruptions.
The key steps involve:
- Ingesting logs from the Fabric API endpoint
- Loading them into Lakehouse
- Setting up alerts for detected issues
Scheduling the flow to run at regular intervals ensures continuous monitoring and timely detection of any problems.
I hope this guide helps you streamline your log management process and improve your overall system efficiency. If you have any questions or need further assistance, feel free to reach out.
Happy automating!